- 最新
- 原创
- 比特币
- 区块链
- Web3
- 以太坊
- NTF
币界网报道:随着币界网的不断壮大和用户群体的扩张,我们注意到市面上出现了一些假冒币界网的非法账号和诈骗信息。为保障您的权益和安全,我们特此发布本公告,提醒所有用户请务必认准以下官方联系方式,避免因个人信息泄露而导致的损失。我们强烈建议您不要轻信任何非官方渠道的信息和链接,谨防受骗。
币界网报道:我们近期注意到一些用户假冒币界官方发布虚假信息,这些信息不仅侵犯了用户的权益,也给我们的平台带来了不良影响。为了保护用户的利益和安全,我们特此发布此公告,提醒大家警惕诈骗行为。
币界网报道:币界网第一期空投活动将在2024年6月3日进行“空投系数值”快照,空投系数值排名前10的用户将会获得空投,具体代币和数量将在快照前5个工作日内公布。
美国法院强制执行美国证券交易委员会传唤埃隆·马斯克作证
币界网报道:美国一家法院正在执行美国证券交易委员会的传票,该传票将迫使埃隆·马斯克在对其收购推特的调查中再次出庭作证。周二的一份法庭文件显示,美国证券交易会将继续在法庭上询问马斯克
区块链
2024-05-15 06:11
谷歌I/O总结:Gemini AI更新、新搜索功能等
币界网报道:谷歌在谷歌I/O 2024期间讨论了Gemini、其人工智能模型、Teor TPU等的更新。这是一个回顾。
区块链
2024-05-15 06:07
Sojitz Corporation和Ginkgo Bioworks宣布计划利用合成生物学研发服务加速日本的可持续制造
币界网报道:--Sojitz,一家在日本生物经济中拥有广泛网络的大型日本综合贸易公司,以及Ginkgo Bioworks(NYSE:DNA),该公司。。。
区块链
2024-05-15 06:01
HTX Ventures投资ChainML,IA Theoriq代理协议的开发,以促进IA代理协议的集中开发
币界网报道:--港口和区块链技术利用的可能性,HTX Ventures,世界投资分支。。。
区块链
2024-05-15 05:59
TCL华星光电携尖端显示产品重返2024 SID显示周,助力美好生活
币界网报道:--TCL华星光电,一家专注于发展显示行业新技术和创新的公司,今天展示了大约40个开创性的。。。
区块链
2024-05-15 05:54
Parity黑客回归,在不活跃7年后在以太坊洗钱900万美元
币界网报道:2017年从Parity Multisig钱包窃取150000 ETH的黑客现在已经清洗了第一批3050 ETH。
区块链
2024-05-15 05:53
以太坊下周会被美国证券交易委员会宣布为安全货币吗?
币界网报道:分析师表示,尽管以太坊ETF现货申请的最后期限迫在眉睫,但对其监管状况的明确答复似乎“不太可能”。
区块链
2024-05-15 05:51
投资者预期Fetch.ai价格修正-COINTURK NEWS
币界网报道:由于潜在的抛售,Fetch.ai价格接近修正。网络增长率已降至七个月来的最低水平。死亡交叉形态可能使FET跌至1.71美元。
区块链
2024-05-15 05:46
Century Complete正在密歇根州纽波特销售新房
币界网报道:--世纪社区,股份有限公司(纽约证券交易所:CCS)-美国最大的房屋建筑商之一,在线房屋销售的行业领导者,以及排名最高的。。。
区块链
2024-05-15 05:34
幸运的GameStop,AMC交易员“将数千变成数百万”
币界网报道:在最新的迷因股票热潮之前幸运地进入的交易员已经将数千美元变成了数百万美元。
区块链
2024-05-15 05:17
以太坊ETF的兴趣在下降:这对未来意味着什么?
币界网报道:以太坊ETF备案的变化反映了预期决策的不确定性。
区块链
2024-05-15 05:09
谷歌推动Gemini人工智能升级,稳步推进OpenAI的ChatGPT
币界网报道:谷歌的Gemini 1.5 Pro拥有100万个多模式代币的上下文窗口,使GPT-4的限制相形见绌,因为它在所有服务中都增强了人工智能功能。
区块链
2024-05-15 05:05
Terra Luna Classic保持强大的支持水平-COINTURK NEWS
币界网报道:Terra Luna Classic在市场停滞的情况下保持支撑在0.0001美元以上。Coinbase的潜在支撑可能会引发LUNC的大幅上涨。技术指标表明Terra Classic的走势是看跌的。
区块链
2024-05-15 05:03
多链记忆币即将推出100倍的潜力——这会是下一个WIF吗?
币界网报道:作为世界上第一个多链迷因币Dogevee,用户可以在主要区块链上持有和交易它。随着高收益赌注的推出,它的推出指日可待,分析师预测
区块链
2024-05-15 05:00
Rollblock(RBLK)有望颠覆在线赌博,有望实现比ETH和SHIB更大的通货紧缩机制
币界网报道:虽然以太坊ETH币由于在altcoin市场上的广泛采用而成为通货紧缩的资产,但Shiba Inu SHIB也获得了类似的赞誉,因为它在模因币中排名第一
区块链
2024-05-15 04:59
阿达马斯托是葡萄牙顶级超级跑车FURIA的代言人
币界网报道:--葡萄牙汽车工业的历史是葡萄牙企业家港口的杰出典范。。。
区块链
2024-05-15 04:58
Tredway创始人兼首席执行官Will Blodgett入选《商业观察报》2024年100强榜单
币界网报道:--Will Blodgett,Tredway的首席执行官兼创始人。Tredway是一家经济实惠的混合收入房地产开发商,致力于建设和保护高质量的,。。。
区块链
2024-05-15 04:57
3M年会强调战略优先事项的进展,提高执行力
币界网报道:--在今天的年度股东大会上,3M(NYSE:MMM)强调了其强大的领先业务组合、领先的材料创新。。。
区块链
2024-05-15 04:50
加载更多
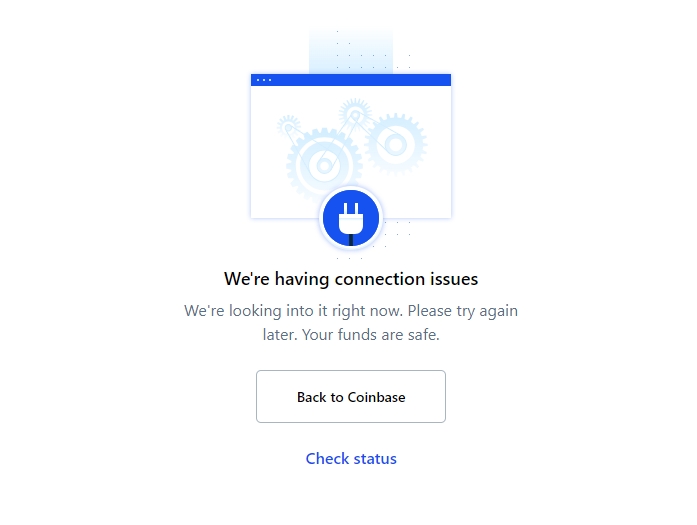
Coinbase官网出现故障 当前访问不了
币界网报道,5月14日,Coinbase官网(包括Coinbase钱包页面)出现长时间宕机状态,目前已经超1个小时不能访问。
专栏
15小时前
【清算TEA TIME】2024.05.13星期一:合约清算规模抬头,你应该知道这些
笔者认为,未来数字货币市场可能会面临连续几年的熊市周期。其原因既包括外部宏观环境的不确定性,也暴露出数字货币行业自身发展周期性矛盾。
专栏
2024-05-13 17:37
BTC再质押链BounceBit空投代币开始发放 即将登陆币安交易
币界网报道,比特币再质押公链BounceBit已公布空投数量查询网站,其空投代币(BB)将在几小时后自动发放到符合条件的钱包地址中,无需用户申领。同时,BounceBit主网将于5月13日(UTC时间)上线。
专栏
2024-05-13 15:08
“特约作者”独家活动来袭~
创作者可获得币界网至少两天的文章置顶权益,置顶文章由作者选取。
专栏
2024-05-09 15:59
“特约作者”币界网招募启动,我们等你!
这篇文章是您进入币界网读者门户的钥匙。如果您通过了关卡,就能自由地进出币界网专栏。
专栏
2024-05-07 11:52
稳定币是什么意思?主流的稳定币有哪些?
稳定币是一种设计用来维持固定汇率以最小化价格波动的加密货币。
专栏
20小时前
区块链资金池是什么意思?区块链资金池详细介绍
区块链资金池是一种利用区块链技术建立的资金集中管理机制,用于管理和分配数字资产。
专栏
20小时前
区块链挖矿是什么意思?一文了解区块链挖矿
区块链挖矿是指通过专门的计算机来解决复杂的数学难题或算法,验证和处理交易,并将其添加到区块链公共账本的过程,从而获得加密货币奖励。
专栏
20小时前
EOS柚子币怎么样?EOS柚子币未来前景分析
EOS柚子币是EOS.IO公链上的原生加密货币,用于在其网络中购买系统资源、参与EOS治理、在原生应用程序上进行价值转移,以及由投资者和投机者核算价值
专栏
20小时前
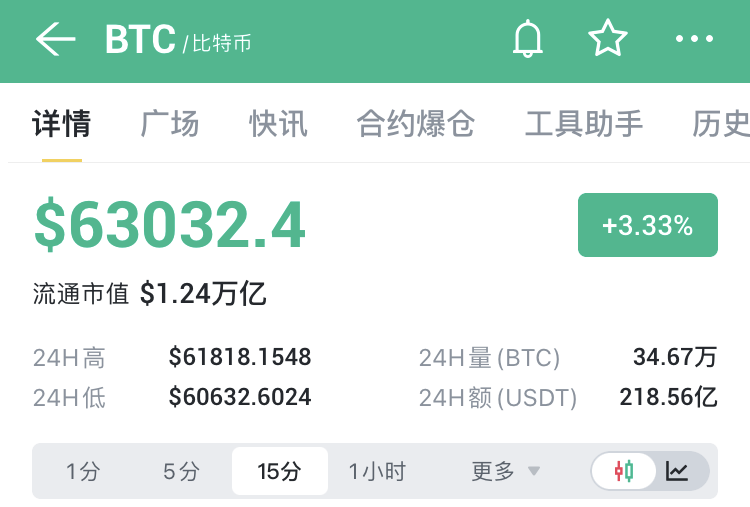
BTC突破63000美元,日内涨幅3.33%
据币界网行情显示,5月13日,比特币(BTC)价格突破63000美元/枚,现报63032.4美元,日内涨幅达到3.33%。
专栏
2024-05-13 17:53
什么是区块奖励?区块奖励是如何分配的?
区块奖励(Block Reward)是指奖励给那些验证交易并向区块链产出新区块的矿工的加密货币。
专栏
2024-05-13 09:01
区块浏览器是什么?区块浏览器如何使用?
区块浏览器是一种软件应用程序,用于提取、可视化和查看区块链网络的各种数据和信息。
专栏
2024-05-13 09:08
蓝筹代币是什么意思?蓝筹代币详细介绍
在加密货币市场,蓝筹代币一般是指那些具有较高市值、良好声誉和广泛认可的数字资产。
专栏
2024-05-13 09:21
BRC20代币有哪些?BRC20代币是否有价值?
BRC20是建立在比特币网络上的一种智能合约代币标准,类似于以太坊网络上的ERC20代币。
专栏
2024-05-13 09:03
今日选题
读文章的、刷视频的、看电影的,其实都是一拨人。他们的需求从来没有变过,所以想教给你的不是狭隘的怎么写文章,而是希望你能更深层次挖掘并满足用户需求。
专栏
2024-05-11 16:51
什么是密码学?密码学是如何实现的?
密码学是有效保护信息免遭数据存储和数据分布相关风险的一种解决方案,通过使用使用特定加密技术来实现。
专栏
2024-05-11 09:13
什么是加密货币?加密货币的优势和劣势是什么?
加密货币是一种数字支付系统,不依赖银行来验证交易。它们构建在区块链技术之上,是一种去中心化的数字货币,使用密码学技术确保交易的安全性和可靠性。
专栏
2024-05-11 09:24
加密协议是什么意思?比特币加密协议有哪些?
加密货币协议是治理去中心化网络中参与者行为的一系列规则和程序,其通过使用密码学技术来保障网络运行的安全性和可靠性。
专栏
2024-05-11 09:53
加密货币ETF是什么?加密货币ETF和股票ETF有哪些差异?
加密货币ETF是一种特殊类型的交易所交易基金(ETF),旨在让投资者能够通过传统金融市场以受监管的方式间接投资于加密货币。
专栏
2024-05-11 09:46
英国《金融时报》2024加密货币与数字资产峰会第二天活动报道
英国《金融时报》FT Live主办的2024年加密货币与数字资产峰会迎来了第二天,现场充满了讨论与创新思想的碰撞。跟随币界网的现场报道,及时了解最新的观点与见解。
专栏
2024-05-10 15:33
威斯康辛州宣布向贝莱德和灰度级比特币ETF控股公司投资1.63亿美元
币界网报道:美国一个州披露了两个重要的比特币(BTC)信托的大量持股情况。
比特币
2024-05-15 05:49
为什么比特币本周没有加入最新的迷因股票热潮
币界网报道:比特币不像三年前那样与表情包股票并驾齐驱。
比特币
2024-05-15 04:06
加密货币分析师预测比特币(BTC)突然反弹,更新XRP展望
币界网报道:一位广受关注的加密货币分析师和交易员认为,比特币(BTC)正在为大幅反弹做准备。
比特币
2024-05-15 02:46
核心开发者表示,比特币的未来“黯淡”,监管成熟
币界网报道:Matt Corallo表示,即使在15年后,比特币仍然缺乏不可靠的扩展解决方案,监管机构正在利用这一点。
比特币
2024-05-15 02:44
萨尔瓦多积累了大量比特币控股-COINTURK NEWS
币界网报道:萨尔瓦多持有5750个BTC,价值约3.5亿美元。该国推广BTC的使用,并用加密货币资助新的企业。BTC价格降至61300美元,市场容量降至1.2万亿美元。
比特币
2024-05-15 01:30
萨尔瓦多持有5750比特币-最新加密货币新闻
币界网报道:萨尔瓦多因其持有大量比特币而成为头条新闻,此举使该国成为加密货币的积极采用者。即使
比特币
2024-05-15 01:16
比特币交易大幅增长-最新加密货币新闻
币界网报道:比特币Runes协议于4月20日与比特币第四次减半同时推出,最初的活动令人印象深刻。然而,Dune的最新数据
比特币
2024-05-15 00:42
比特币Runes协议面临活动大幅下降-COINTURK NEWS
币界网报道:比特币Runes协议在30天内的每日交易量下降了99%。最初的兴奋情绪减弱,反映出更广泛的市场趋势和交易员兴趣的下降。新的事态发展正在进行中,有可能重振符文议定书。
比特币
2024-05-15 00:27
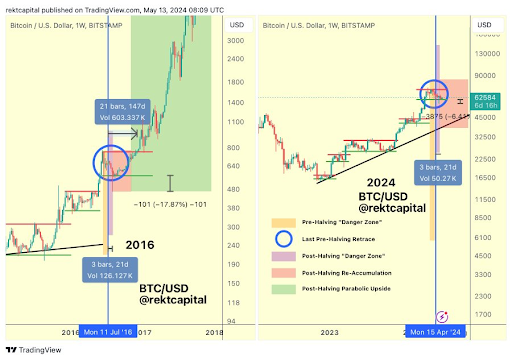
比特币走出了“危险区”——牛市终于来了吗?
币界网报道:根据历史周期数据,比特币最近的复苏表明比特币已经摆脱了减半后的下跌。
比特币
2024-05-15 00:25
市场专家称比特币价格已正式脱离危险区,价格能否突破10万美元?
币界网报道:加密货币分析师Rekt Capital最近表示,比特币最糟糕的时期可能已经过去,他透露比特币的价格现在已经离开了危险区。
比特币
2024-05-15 00:02
威斯康星州持有1.63亿美元贝莱德灰度比特币ETF股票
币界网报道:一份文件显示,威斯康星州投资委员会已从贝莱德和灰度级比特币交易所购买了股票。
比特币
2024-05-14 23:52
Tether和RAK DAO合作在Ras Al Khaimah推广比特币和Stablecoin教育
币界网报道:数字资产行业的领先公司Tether Operatio Limited宣布与RAK digital Assets Oasis RAK DAO签署谅解备忘录。该谅解备忘录标志着朝着启动迈出了第一步
比特币
2024-05-14 23:44
Bracebridge Capital成为最大的现货比特币ETF持有者
币界网报道:对冲基金Bracebridge Capital披露了比特币现货ETF的大量股份,包括ARKB、IBIT和GBTC。
比特币
2024-05-14 23:38
比特币Layer2爆发前夜 我们可以从以太坊L2上学到什么?
币界网报道:比特币生态再次迎来了自己的春天,吸引了大量的资金、用户和开发者。
比特币
2024-05-14 23:30
PlanB预测比特币矿工的收入复苏-COINTURK NEWS
币界网报道:比特币一直在一个价格区间内波动,这让投资者感到厌倦。PlanB预测矿工收入在减半后将复苏。Adam Back强调矿工的盈利能力和减少的销售额。
比特币
2024-05-14 23:29
传奇交易员Peter Brandt表示,XRP对比特币(BTC)的汇率似乎将为零——原因如下
币界网报道:资深交易员Peter Brandt认为,随着XRP对比特币(BTC)接近历史低点,其价值可能会暴跌。
比特币
2024-05-14 23:09
比特币触底5.6万美元?BTC价格图表暗示几天内将突破
币界网报道:著名分析师 Rekt Capital 表示,除了看涨的技术形态之外,比特币的发行“危险区”已正式结束。
比特币
2024-05-14 23:00
威斯康星州投资委员会持有贝莱德近1亿美元的比特币ETF
币界网报道:威斯康星州投资委员会SWIB披露,它购买了近1亿股贝莱德的比特币ETF IBIT。该州养老金周二披露了其在13F中的持股情况。高级ETF分析师Eric Balchunas表示
比特币
2024-05-14 22:56
加载更多
币界网报道:随着币界网的不断壮大和用户群体的扩张,我们注意到市面上出现了一些假冒币界网的非法账号和诈骗信息。为保障您的权益和安全,我们特此发布本公告,提醒所有用户请务必认准以下官方联系方式,避免因个人信息泄露而导致的损失。我们强烈建议您不要轻信任何非官方渠道的信息和链接,谨防受骗。
币界网报道:我们近期注意到一些用户假冒币界官方发布虚假信息,这些信息不仅侵犯了用户的权益,也给我们的平台带来了不良影响。为了保护用户的利益和安全,我们特此发布此公告,提醒大家警惕诈骗行为。
币界网报道:币界网第一期空投活动将在2024年6月3日进行“空投系数值”快照,空投系数值排名前10的用户将会获得空投,具体代币和数量将在快照前5个工作日内公布。
美国法院强制执行美国证券交易委员会传唤埃隆·马斯克作证
币界网报道:美国一家法院正在执行美国证券交易委员会的传票,该传票将迫使埃隆·马斯克在对其收购推特的调查中再次出庭作证。周二的一份法庭文件显示,美国证券交易会将继续在法庭上询问马斯克
区块链
2024-05-15 06:11
谷歌I/O总结:Gemini AI更新、新搜索功能等
币界网报道:谷歌在谷歌I/O 2024期间讨论了Gemini、其人工智能模型、Teor TPU等的更新。这是一个回顾。
区块链
2024-05-15 06:07
Sojitz Corporation和Ginkgo Bioworks宣布计划利用合成生物学研发服务加速日本的可持续制造
币界网报道:--Sojitz,一家在日本生物经济中拥有广泛网络的大型日本综合贸易公司,以及Ginkgo Bioworks(NYSE:DNA),该公司。。。
区块链
2024-05-15 06:01
HTX Ventures投资ChainML,IA Theoriq代理协议的开发,以促进IA代理协议的集中开发
币界网报道:--港口和区块链技术利用的可能性,HTX Ventures,世界投资分支。。。
区块链
2024-05-15 05:59
TCL华星光电携尖端显示产品重返2024 SID显示周,助力美好生活
币界网报道:--TCL华星光电,一家专注于发展显示行业新技术和创新的公司,今天展示了大约40个开创性的。。。
区块链
2024-05-15 05:54
Parity黑客回归,在不活跃7年后在以太坊洗钱900万美元
币界网报道:2017年从Parity Multisig钱包窃取150000 ETH的黑客现在已经清洗了第一批3050 ETH。
区块链
2024-05-15 05:53
以太坊下周会被美国证券交易委员会宣布为安全货币吗?
币界网报道:分析师表示,尽管以太坊ETF现货申请的最后期限迫在眉睫,但对其监管状况的明确答复似乎“不太可能”。
区块链
2024-05-15 05:51
投资者预期Fetch.ai价格修正-COINTURK NEWS
币界网报道:由于潜在的抛售,Fetch.ai价格接近修正。网络增长率已降至七个月来的最低水平。死亡交叉形态可能使FET跌至1.71美元。
区块链
2024-05-15 05:46
加载更多
Web3隐私数据终局将至?一览FHE赛道
币界网报道:FHE 的应用场景广阔,它面向的是整个互联网体系下的任何隐私数据。
Web3
2024-05-14 22:08
UXLINK如何通过“执两用中”突破Web3社交天花板?
币界网报道:UXLINK采用了“执两用中”的叙事脉络和产品构思,具备更强的可延展性和无限天花板。
Web3
2024-05-14 21:35
SevenX Ventures:UXLINK如何通过“执两用中”突破 Web3 社交天花板?
币界网报道:UXLINK采用了“执两用中”的叙事脉络和产品构思,具备更强的可延展性和无限天花板。
Web3
2024-05-14 20:30
Web3
2024-05-14 17:42
Oasys:一座链游赛道的Web2与Web3之间的桥梁
币界网报道:日本Web2游戏入局链游又会产生什么样的火花?对于当下的链游生态带来怎样的变革?
Web3
2024-05-14 16:30
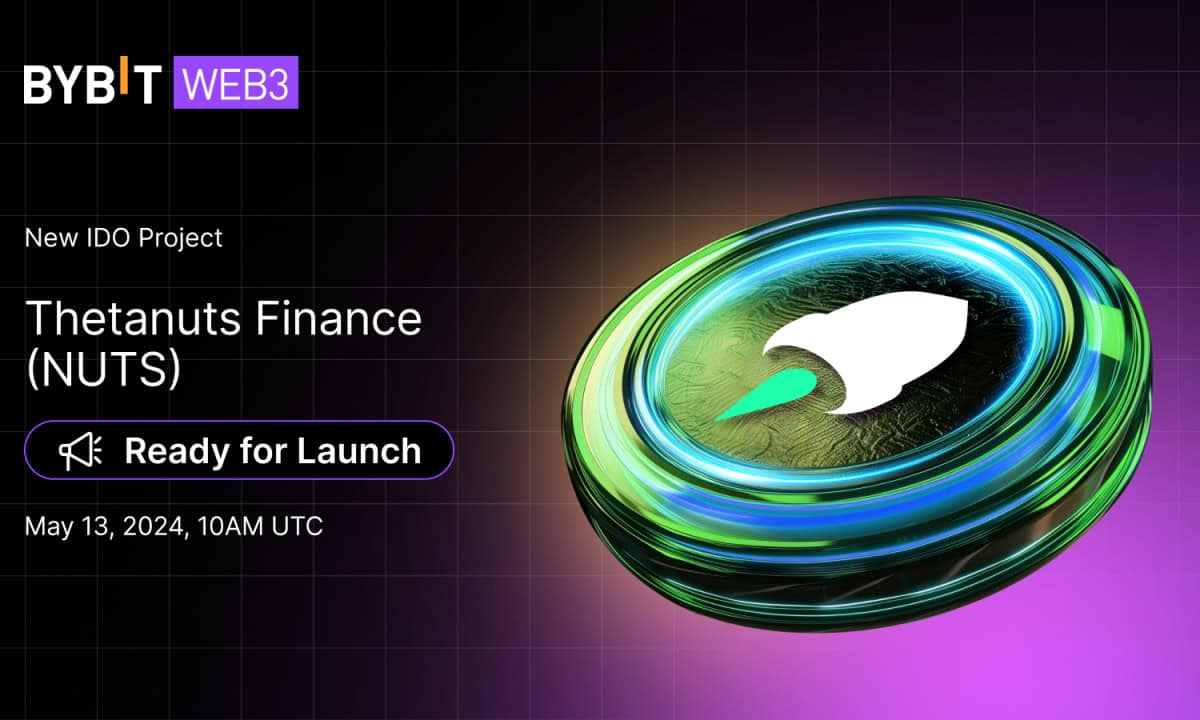
Bybit Web3宣布即将推出的Thetanuts(NUTS)IDO
币界网报道:全球三大加密货币交易所之一Bybit的Web3部门Bybit Web3今天宣布即将进行首次DEX发行
Web3
2024-05-14 12:40
Web3
2024-05-14 03:38
Pudgy Penguins现象:从数字到有形的成功|NFT文化|NFT新闻|Web3文化|NFTs和加密艺术
币界网报道:最新的NFT新闻、NFT和Web3见解等。Pudgy Pengui现象:从数字到有形的成功| NFT新闻
Web3
2024-05-13 17:57
加载更多
Glassnode:质押动态及衍生品市场变化对以太坊生态有何影响
币界网报道:Dencun 升级、ETH 价格突破4000美元、以太坊质押显著增加对以太坊网络有何广泛影响?
以太坊
2024-05-11 15:30
以太坊存储方案路线图:挑战与机遇共存
币界网报道:目前EthStorage 测试网正在以太坊 Sepolia 测试网上运行,多名社区参与者已成功证明了他们的本地存储状况。
以太坊
2024-04-15 16:30
Bankless联创:区块大小之争与以太坊统一架构之路
币界网报道:2015年到2017年,比特币经历了一场众所周知的区块大小之战。争论点在于:我们要增加区块大小吗?还是说我们保持一定的区块大小,向更高的层强制扩展?
以太坊
2024-04-15 14:30
Vitalik香港Web3嘉年华演讲全文:达到协议设计的极限
币界网报道:2024 香港 Web3 嘉年华期间,以太坊联合创始人 Vitalik Buterin 发表主旨演讲《Reaching the Limits of Protocol Design》。将演讲内容整理如下,以飨读者。
以太坊
2024-04-09 16:30
以太坊社区的质押争论到底在探讨什么?
币界网报道:以太坊社区正在争论以太坊基金会的权力和责任,一些人认为以太坊基金会通过建议修改以太坊发行来扮演央行行长的角色。
以太坊
2024-04-07 10:30
Solana基金会前主管:Solana或在DApp方面超越以太坊
币界网报道:Solana 基金会前增长主管表示,Solana 在消费者 DApp 方面可能会超过以太坊。
以太坊
2024-03-22 22:30
以太坊生态"王炸"明牌 已诞生100亿美金TVL独角兽
币界网报道:以太坊链的质押赛道逐渐衍变成千亿市值的赛道,截止目前,以太坊锁仓量达到4180万枚,占比超35%,而锁仓量的上升,让以太坊上涨变得更加容易。
以太坊
2024-03-22 13:30
Dencun 升级后 Base每日交易量激增至 200 万笔
币界网报道:由于 Dencun 升级后费用大幅降低,Base 每日交易量增长了 350%。
以太坊
2024-03-20 09:27
加载更多
专访比特币NFT创始人:让比特币再次变得有趣
币界网报道:比特币正在再次尝试 NFT。首先是2012年出现了彩色币,旨在代表比特币上所有类型的非比特币资产。然后在2014年出现了 Counterparty,它是作为比特币的衍生品而构建的,允许创建、买卖由其 XCP 代币支持的数字资产。Counterparty 是“Rare Pepes”(受Pepe the Frog 模因启发的 NFT )于 2016 年诞生的地方,它远远早于我们今天所知的以太坊 NFT。这一次,它是 Ordinal NFT 和铭文,它们是由Casey Rodarmor开发的Ordinal 协议……
NFT
2023-03-03 17:09
版税不断降低,NFT创作者该如何应对?
币界网报道:随着 NFT 生态系统的不断发展,零收费或低收费的市场不断涌现,许多创作者面临着二次销售的版税收入减少。
NFT
2023-03-03 17:00
从全球市场展望2023年NFT发展趋势
币界网报道:粗略来算,目前的NFT市场体量大约和2017年的加密市场体量相近,在2017年1月加密市场总市值首次达到200亿美元后,开始了一段下跌行情,两周跌去了总市值的四分之一,随后花费较长时间不断修复开启了新的上涨行情,而NFT市场可能也会经历相同的调整周期,这些都意味着NFT投资将从旁氏经济开始向价值投资过渡。
NFT
2023-03-01 16:19
“狂飙”数藏溢价绑售黄金月卡,爱奇艺“镰刀”挥向数藏市场
币界网报道:以数藏溢价捆绑会员,爱奇艺“急赚钱”的既视感喷薄而出。刚刚过去的2022年,这家视频门户实现了290亿元营收,上涨的会员费加上爆款剧集带来了会员增量,终于让爱奇艺在连续亏损12年后扭亏为盈。
NFT
2023-03-01 16:09
详解「序数NFT」:在比特币上铸造NFT的新尝试
币界网报道:最近出现了一种在比特币区块链上铸造非同质代币(NFT)的新方法,它可以将 NFT 的实质内容完全放到比特币区块链上。
NFT
2023-02-27 16:20
“音乐天后”蕾哈娜发行NFT售罄,音乐NFT赛道该如何破局?
币界网报道:近期,9 座格莱美奖得主、音乐天后蕾哈娜(Rihanna)的曲目《Bitch Better Have My Money》通过 Web3 音乐初创公司 AnotherBlock 铸造并发行了音乐 NFT。这个音乐 NFT 限量 300 个,售价 210 美元,在开售后几分钟内便售罄。
NFT
2023-02-22 16:29
浅析如何对一款 NFT 项目进行价值评估?
币界网报道:原文作者 |Othmane Senhaji Rhazi,Web 3 企业家.编译整理 | 黑米@白泽研究院我之所以成为一位大力倡导 Web3 和 NFT 领域的企业家,因为我相信我们正在见证社会、经济和创新的突破。NFT 是一种创新,它通过区块链上的独特资产将具有内在价值或欣赏价值的事物大规模地标记化,并具有在共享上的潜力。这个框架是给谁的?- 热衷于 NFT 项目的爱好者,-...
NFT
2023-02-20 17:29
NFT估值需要考虑哪些因素?
币界网报道:不可替代代币(NFT)市场正在飙升,越来越多的人正在创造、购买、出售和交换NFT。这个新市场存在许多挑战,最大的挑战之一是NFT的估值。NFT的估值是一个很大的未知数。没有关于 NFT 应该如何估值的案例,其最接近的类比,即对艺术品的估值,也是相当模糊的。NFT需要一种新的估值方法,以及一种更好的管理与NFT相关的数字资产的手段,以保持该价值。公平的市场估值公平市场价值是指买卖...……
NFT
2023-02-20 17:26
加载更多


 iOS版下载
 安卓版下载
安卓版下载







































 App Store
 Android
